A Hierarchical Spatial Graph Neural Network Resolves Immunogenic and Tolerogenic Tertiary Lymphoid Structures in Renal Cell Carcinoma
A Hierarchical Spatial Graph Neural Network Resolves Immunogenic and Tolerogenic Tertiary Lymphoid Structures in Renal Cell Carcinoma
Peng, G.
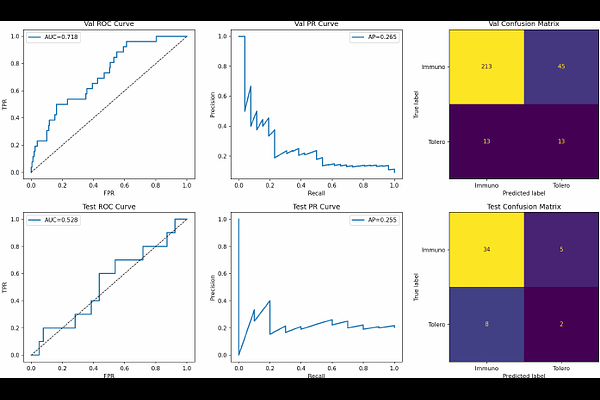
AbstractAbstract Tertiary lymphoid structures (TLS) in the tumour microenvironment span a functional spectrum from immunogenic -- driving germinal centre reactions and anti-tumour immunity -- to tolerogenic, harbouring regulatory T cells and suppressive myeloid populations. Distinguishing these states is clinically critical: immunogenic TLS predict ICI response whereas tolerogenic TLS may promote immune evasion. Bulk transcriptomics conflates productive TLS with exhausted immune infiltrates, masking this distinction. We present a hierarchical graph neural network (GNN) that operates directly on 10x Visium spatial transcriptomics graphs to classify TLS functional state at the cluster level. Using a three-scale architecture combining graph attention (GAT) and differentiable pooling (DiffPool), the model hierarchically aggregates spot-level signals into niche- and region-level representations before predicting immunogenic versus tolerogenic state. Trained on 915 TLS clusters from 24 renal cell carcinoma (RCC) Visium samples (GSE175540), the model achieves a validation AUC-ROC of 0.718 and a clinical AUC of 0.908 on IgG-validated samples from the BIONIKK cohort. Zero-shot transfer to an independent multi-cancer Visium cohort (GSE203612; breast, liver, ovarian, pancreatic, uterine) correctly identifies hepatocellular carcinoma as harbouring the most tolerogenic TLS, consistent with the known immunosuppressive liver tumour microenvironment. Spatial decomposition of CXCL13 across TLS and non-TLS compartments reveals that 85% of tissue CXCL13 signal originates from non-TLS parenchyma, where it co-expresses primarily with exhaustion markers (mean Spearman rho = 0.233) rather than Tfh markers (CXCR5 rho = 0.039) -- a pattern consistent with the paradoxical association of bulk CXCL13 with worse overall survival in TCGA-KIRC (HR = 1.38, p < 0.001). Code and processed data are deposited at GitHub and Zenodo.