MSI-VISUAL: New visualization methods for mass spectrometry imaging and tools for interactive mapping and exploration of m/z values
MSI-VISUAL integrates established dimensionality reduction techniques and introduces four novel visualization methods for MSI. Saliency (SALO) and Spearman (Spear) Optimizations directly optimize for global structure preservation and robustness across different distance metrics, addressing key challenges in MSI visualization. TOP3 and Percentile Ratio (PR3D) provide memory-efficient and computationally fast visualizations, enabling efficient analysis of large-scale MSI datasets. Through comprehensive benchmarking across diverse MSI images, we demonstrate that our proposed visualizations outperform existing techniques, revealing hidden anatomical details with high global structure preservation. We further showcase MSI-VISUAL’s capability for rapid visual analysis of pathological structures, efficiently mapping m/z distributions for brain atlas sub-regions without MRI registration. Additionally, we map specific m/zs for Aβ-plaques, brain tumors, kidney regions, and more, uncovering novel biological insights—such as shared lipid compositions between spinal cord neurons and brain Aβ-plaques. By enabling efficient, interactive, and biologically meaningful MSI data interpretation, MSI-VISUAL serves as a powerful resource for both research and clinical applications.
https://github.com/jacobgil/msi_visual
MSI-VISUAL: New visualization methods for mass spectrometry imaging and tools for interactive mapping and exploration of m/z values
Gildenblat, J.; Pahnke, J.
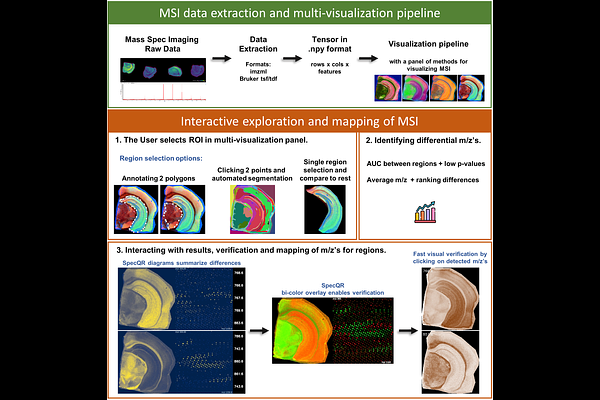
AbstractMass Spectrometry Imaging (MSI) generates high-dimensional molecular data, offering detailed biochemical insights. However, existing MSI software relies primarily on manual pixel-wise m/z selection, limiting the efficiency and depth of data exploration. There is a critical need for computationally advanced, interactive, and automated visualization tools tailored for MSI analysis. We introduce MSI-VISUAL, an open-source framework for fast, interactive, and intuitive MSI data exploration. It enables automatic and manual region selection, statistical comparisons, and real-time visual verification. MSI-VISUAL integrates established dimensionality reduction techniques and introduces four novel visualization methods for MSI. Saliency (SALO) and Spearman (Spear) Optimizations directly optimize for global structure preservation and robustness across different distance metrics, addressing key challenges in MSI visualization. TOP3 and Percentile Ratio (PR3D) provide memory-efficient and computationally fast visualizations, enabling efficient analysis of large-scale MSI datasets. Through comprehensive benchmarking across diverse MSI images, we demonstrate that our proposed visualizations outperform existing techniques, revealing hidden anatomical details with high global structure preservation. We further showcase MSI-VISUAL\'s capability for rapid visual analysis of pathological structures, efficiently mapping m/z distributions for brain atlas sub-regions without MRI registration. Additionally, we map specific m/zs for Abeta-plaques, brain tumors, kidney regions, and more, uncovering novel biological insights, such as shared lipid compositions between spinal cord neurons and brain Abeta-plaques. By enabling efficient, interactive, and biologically meaningful MSI data interpretation, MSI-VISUAL serves as a powerful resource for both research and clinical applications.