Comparative Approaches for Quantification of Product Yield in a Model Recombinant Green Fluorescent Protein Expressed in E. coli


Comparative Approaches for Quantification of Product Yield in a Model Recombinant Green Fluorescent Protein Expressed in E. coli
Rusch, G.; Wang, J.; Breau, K. A.; Kilgour, K.; Gilleskie, G.; Keele, J.; Selle, K.; Magness, S. T.; Menegatti, S.; Daniele, M.
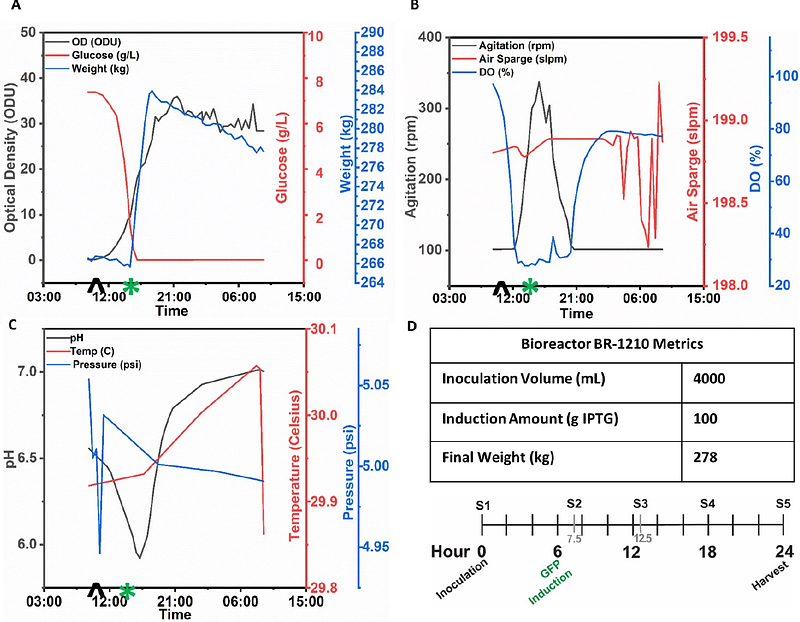
AbstractProcess Analytical Technologies (PAT) used to monitor and control manufacturing processes are crucial for efficient and automated bioprocessing, which is in congruence with lights-off-manufacturing and Industry 4.0 initiatives. As biomanufacturing seeks to realize more high-throughput and automated operation, an increasing need for multimodal analysis of process metrics becomes essential. Herein, we detail a series of methods for analyzing product yield from a bioreactor and how to conduct cross-method comparisons. We employ a model system of Escherichia coli (E. coli) expression of green fluorescent protein (GFP), which is a simple, cost effective model for students and educators to replicate at different scales. GFP is an ideal analytical marker as it is easy to visualize due to its fluorescence which indicates cellular protein expression, cell localization and physiological changes of the cell population. In this study, samples from a 300 L bioreactor with GFP-expressing E. coli are analyzed to improve product yield and bioprocessing efficiency. Utilizing a fed-batch process for enhanced cell density and product titer, this bioreactor runs on a 24-hour schedule from inoculation to GFP induction and final harvest. To reliably quantify relative GFP expression and E. coli proliferation, we provide simple protocols and example results for comparing three different analytical methods: (1) in-line bioreactor measurements, (2) plate reader assays, and (3) microscopy. The GFP and cell density results follow similar trends based on the various inline and offline analytical methods and show a peak of GFP expression and cell density between 12.5 and 18 hours post inoculation.